Relationships & Visualization
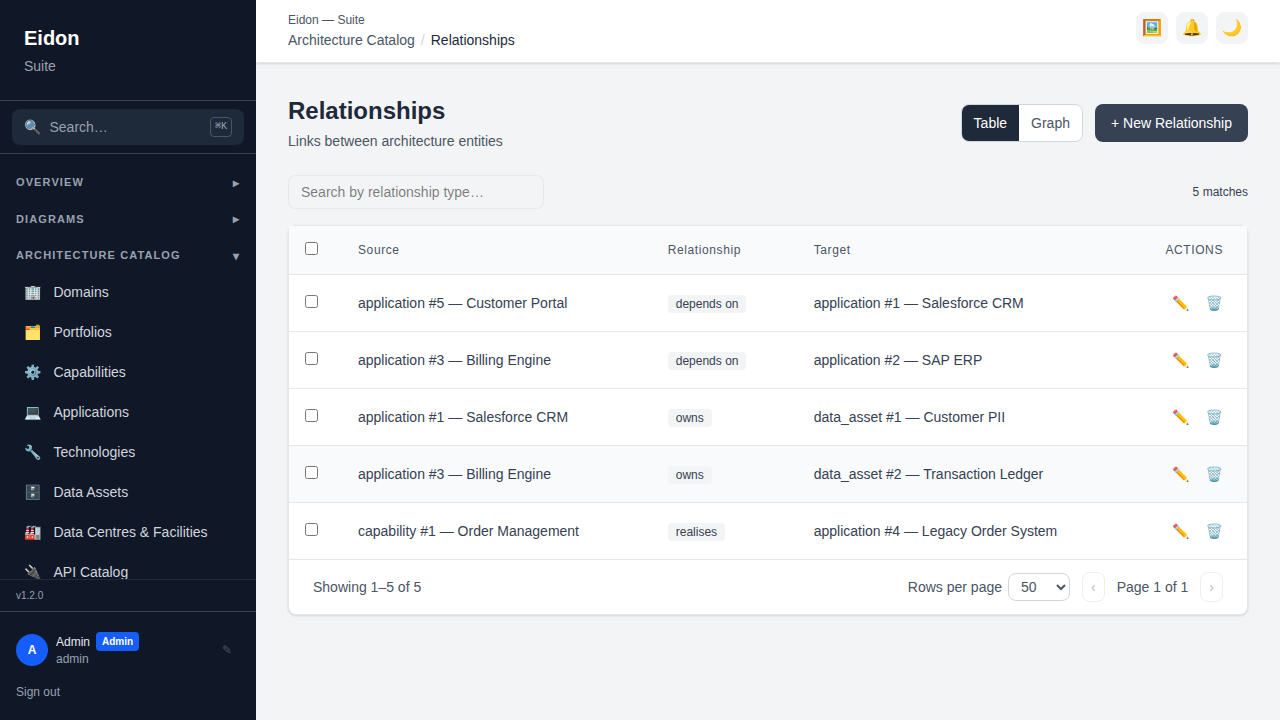
Relationships
A hub for typed links between any two entities — domain, capability, application, technology or data asset. Relationship types include uses, owns, depends_on, integrates_with, replaces and realises. Available as a table or a D3 force-directed graph; linking a domain to a capability automatically syncs the capability's domain.
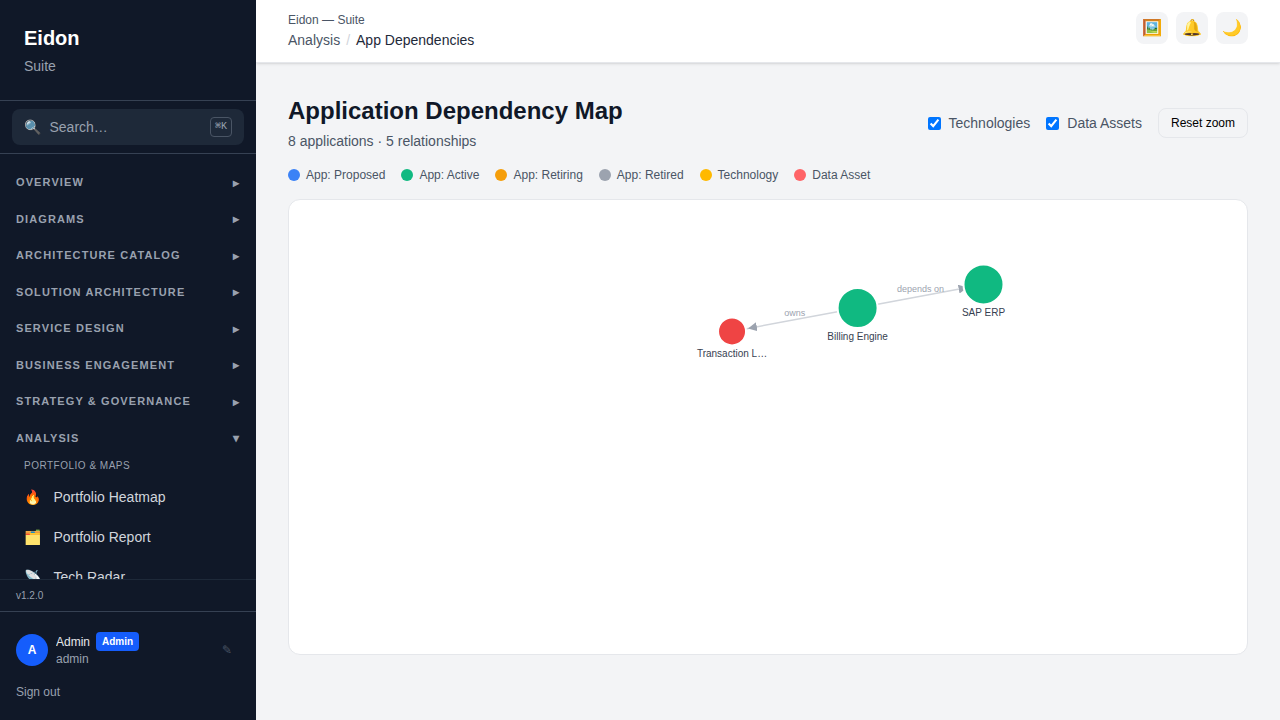
App Dependency Map
A force-directed graph centred on applications, with optional technology and data-asset layers you can toggle on top, and dashed lines specifically marking API producer→consumer edges so the integration topology is visually distinct from ordinary "depends on" relationships. Useful for answering "what breaks if this application goes down" at a glance, before drilling into the underlying relationship records.
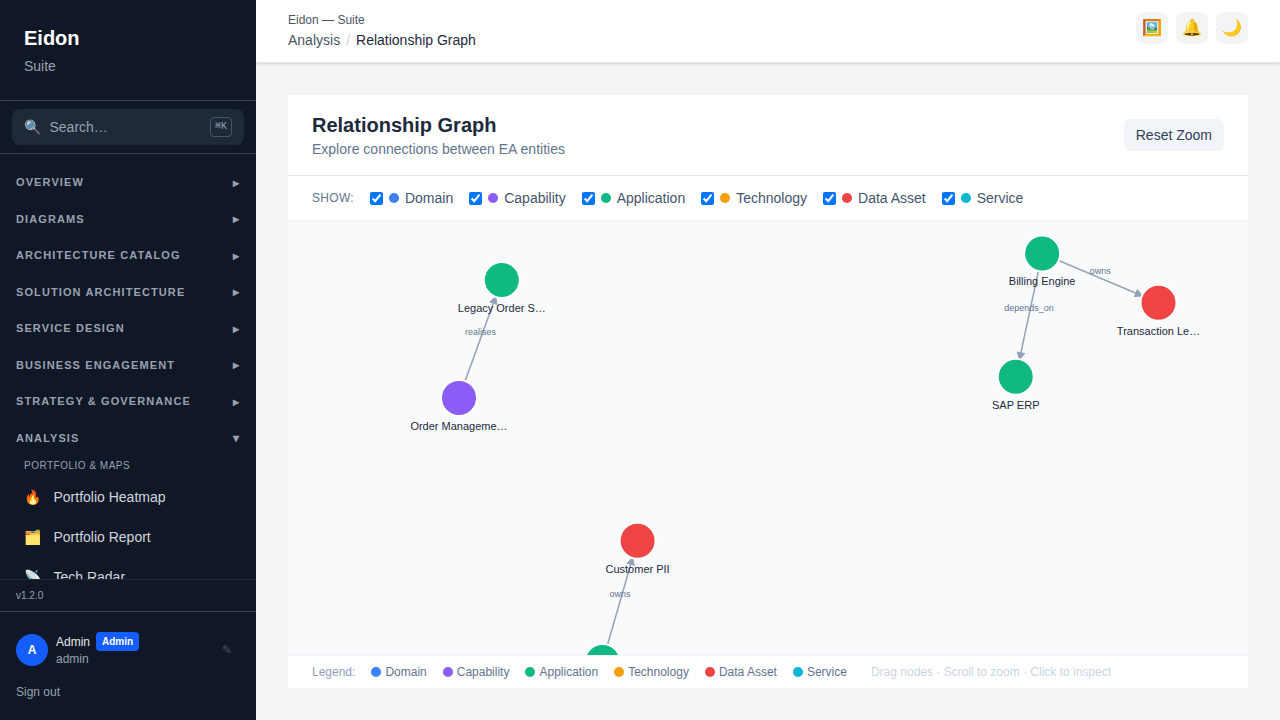
Relationship Graph
A general-purpose D3 graph spanning all entity types (not just applications), filterable by relationship type, letting you inspect any node's incoming and outgoing links. The graph auto-lays-out its nodes and can be exported from the side panel as PNG (for slides/docs), SVG (vector), or a draw.io/Visio-importable file that keeps each node's entity type and id so it can be re-linked back into the live catalog after editing externally.
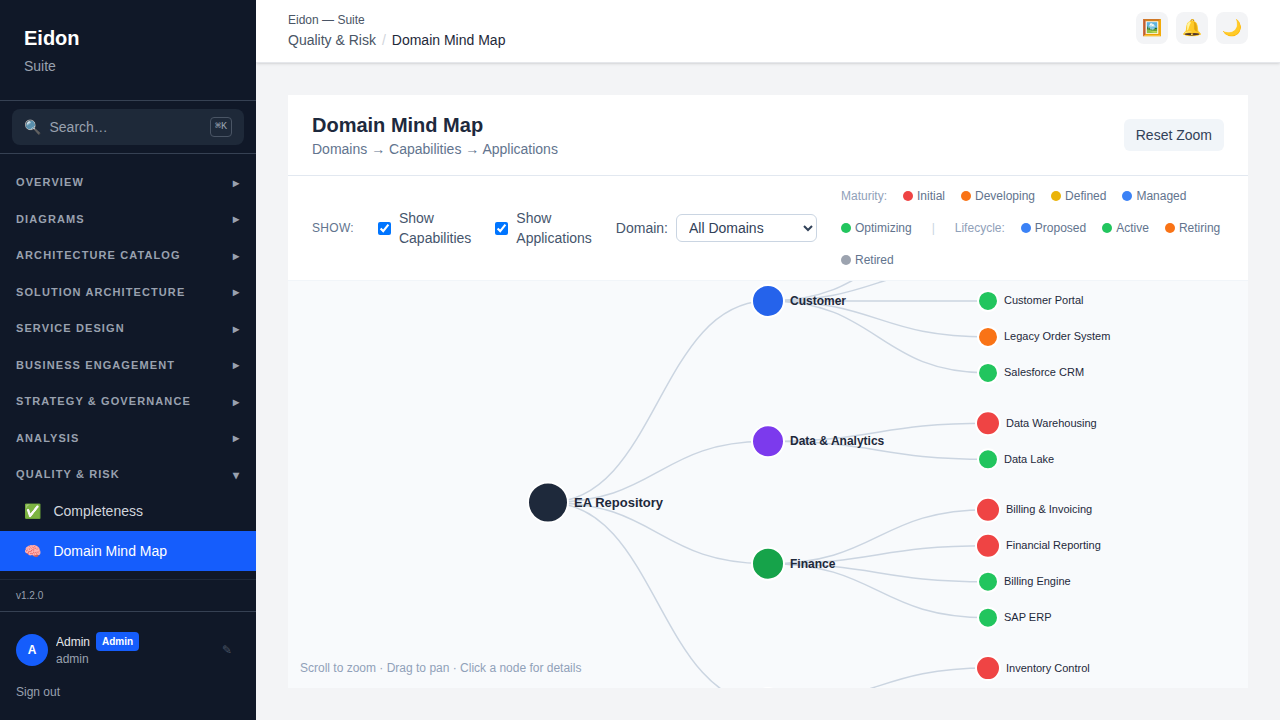
Domain Mind Map
A tree view showing Domain → Capability → Application, giving a quick hierarchical sense of what each part of the business is made of. Records not yet linked to a domain are collected into an "Unassigned" bucket so nothing is silently hidden from the map.
Diagrams (Data Flow, Free Draw, Target Architecture)
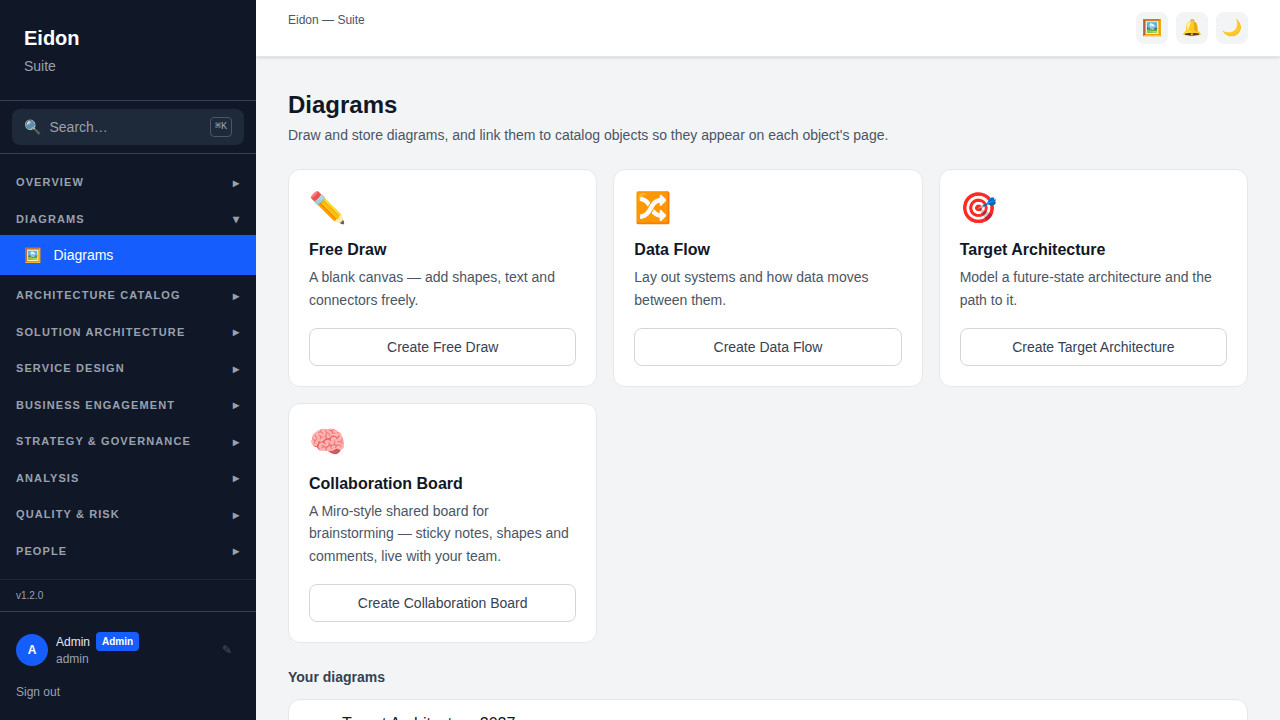
The Diagrams page (its own top-level "Diagrams" section in the sidebar) lets you draw, save and reuse canvases linked to catalog objects. Three types are available: Data Flow and Target Architecture use a structured node/edge canvas, while Free Draw is a true whiteboard. Add real entities from your inventory as nodes, auto-connect them using existing relationships and data flows, and "expand neighbours" to pull in connected entities; ctrl/cmd-click a node to jump to its live record. A diagram can be linked to one or more entities so it surfaces in a Diagrams panel on each of those objects' detail pages — including Solution Designs and Service Blueprints, not just EA catalog entities. Target Architecture diagrams support multiple named pages within the same diagram (e.g. "Current State" and "Target State" as separate tabs) and can be compared side-by-side against the current state. Diagrams export to draw.io/Visio, show thumbnails in the list view, keep a full version history with rollback, and support live multi-user collaborative editing with visible presence and per-user undo, so a whole team can work on the same canvas at once, similar to a shared whiteboard. Editors can create and edit; viewers can open diagrams read-only.