Reports
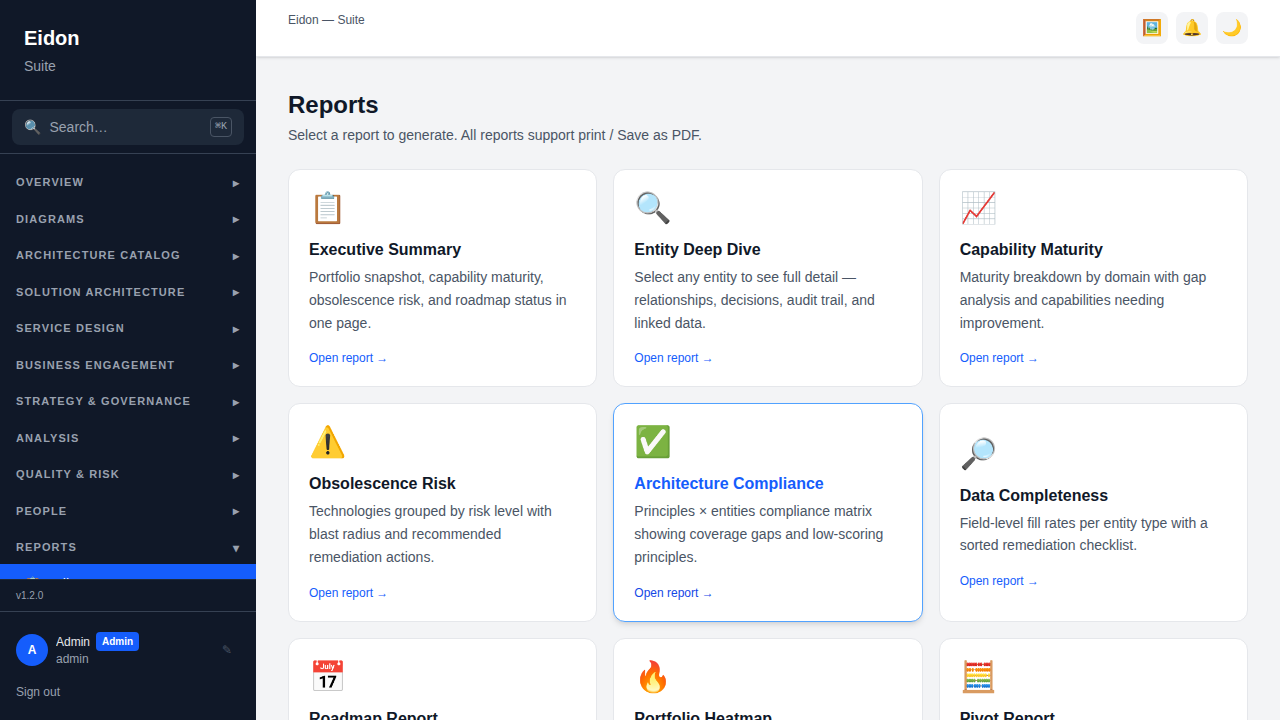
Reports landing page
The Reports section is a hub of printable, exportable report types, each generated on demand with a customisable title and exportable to PDF via print. These are designed to be shared with executives, auditors or program managers as a formatted snapshot. Printed/PDF reports carry the workspace's white-label branding (logo, app name, primary colour) in their header, and notification emails are likewise branded with the workspace's display name, so shared artifacts match the rest of the tenant's look-and-feel. The print view keeps its colours — stat tiles, maturity bars, heatmaps and status pills come through in the saved PDF without needing the browser's "Background graphics" option, and printing always uses the light theme even if you work in dark mode. Admins can also schedule recurring delivery under Settings → Report Subscriptions: pick a report, a cadence (weekly/monthly/quarterly), and recipient emails, and a branded digest with headline metrics and a link to the full report is emailed automatically (requires SMTP).
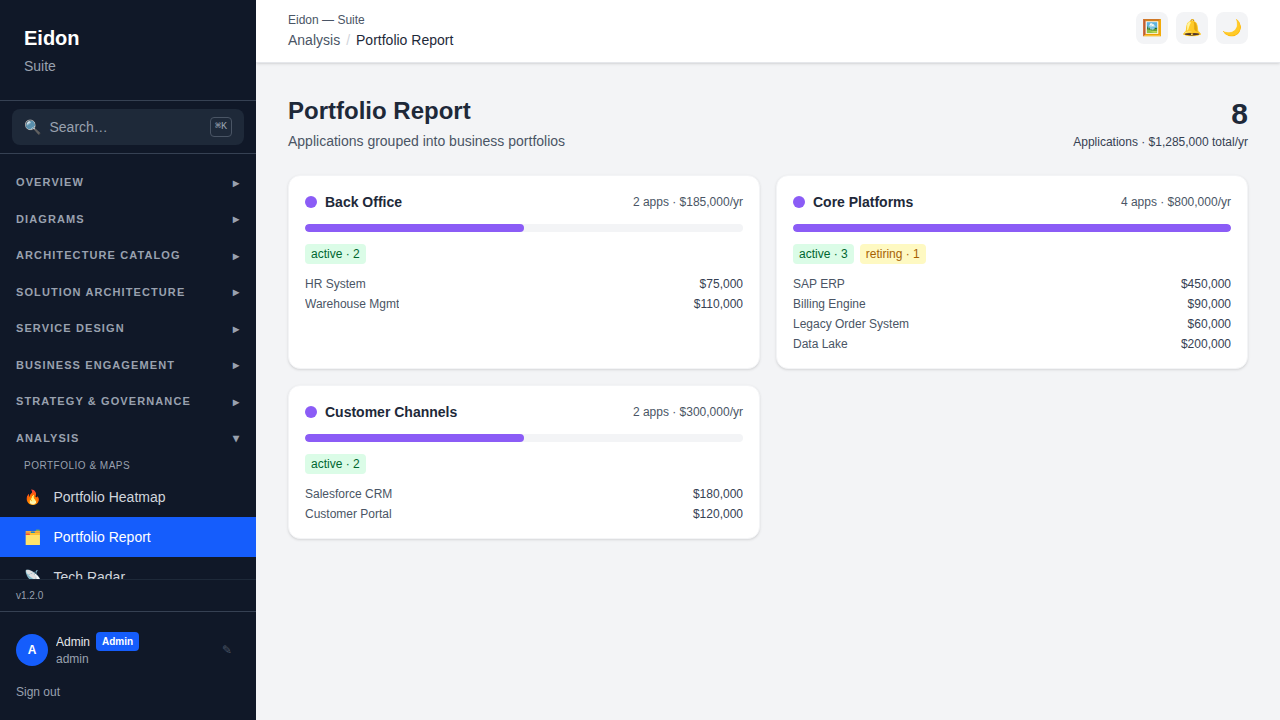
Portfolio Report
A formatted, printable snapshot of the application and technology portfolio — lifecycle mix, domain/portfolio breakdown and headline counts — the same underlying data as the Portfolio Heatmap and Dashboard, laid out for sharing rather than interactive exploration.
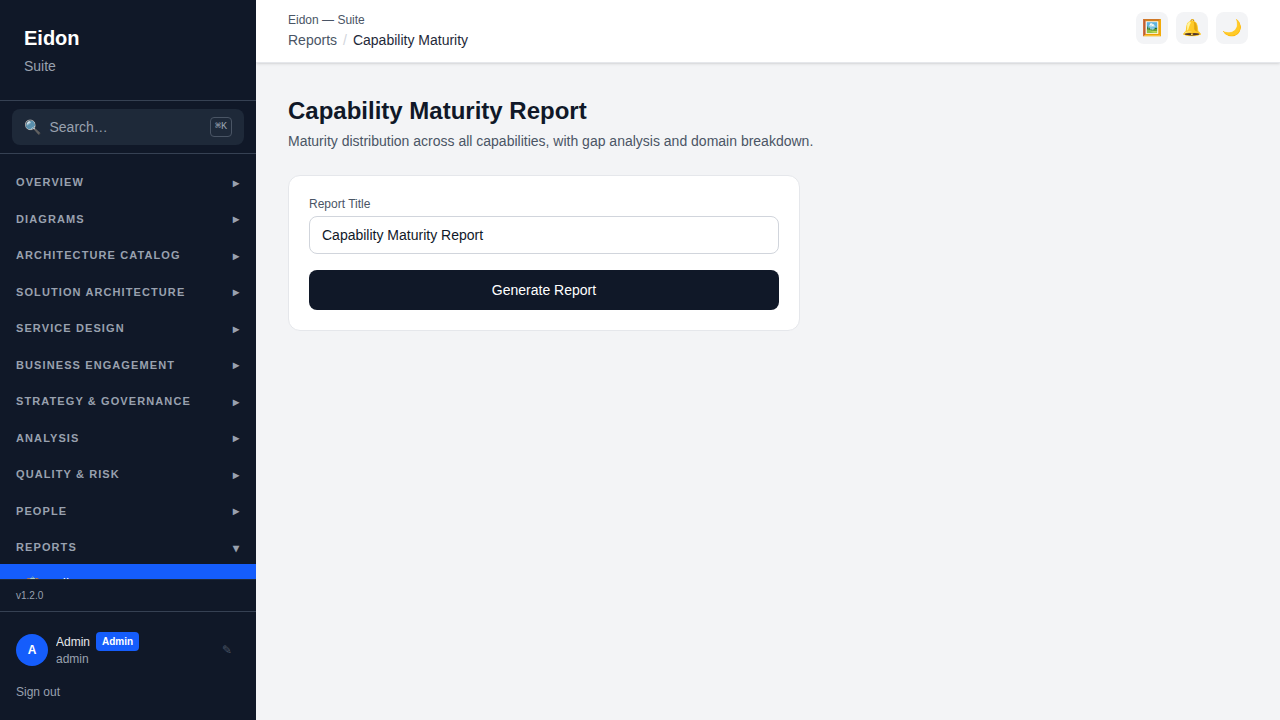
Capability Maturity Report
A printable version of the Capability Maturity tree — current vs. target maturity per domain — formatted for a governance pack or steering-committee deck rather than the interactive editing view.
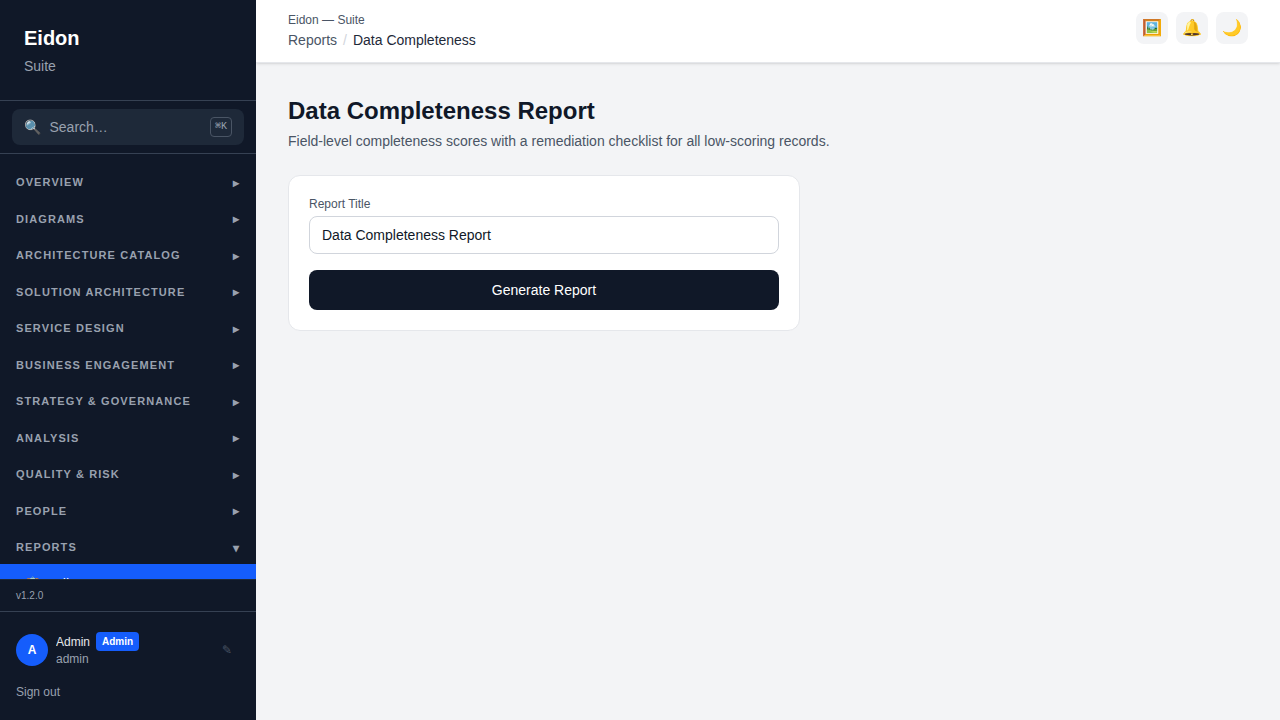
Completeness Report
A printable snapshot of catalog data-quality health, summarising the same completeness scoring shown on Quality & Risk → Completeness in a shareable format.
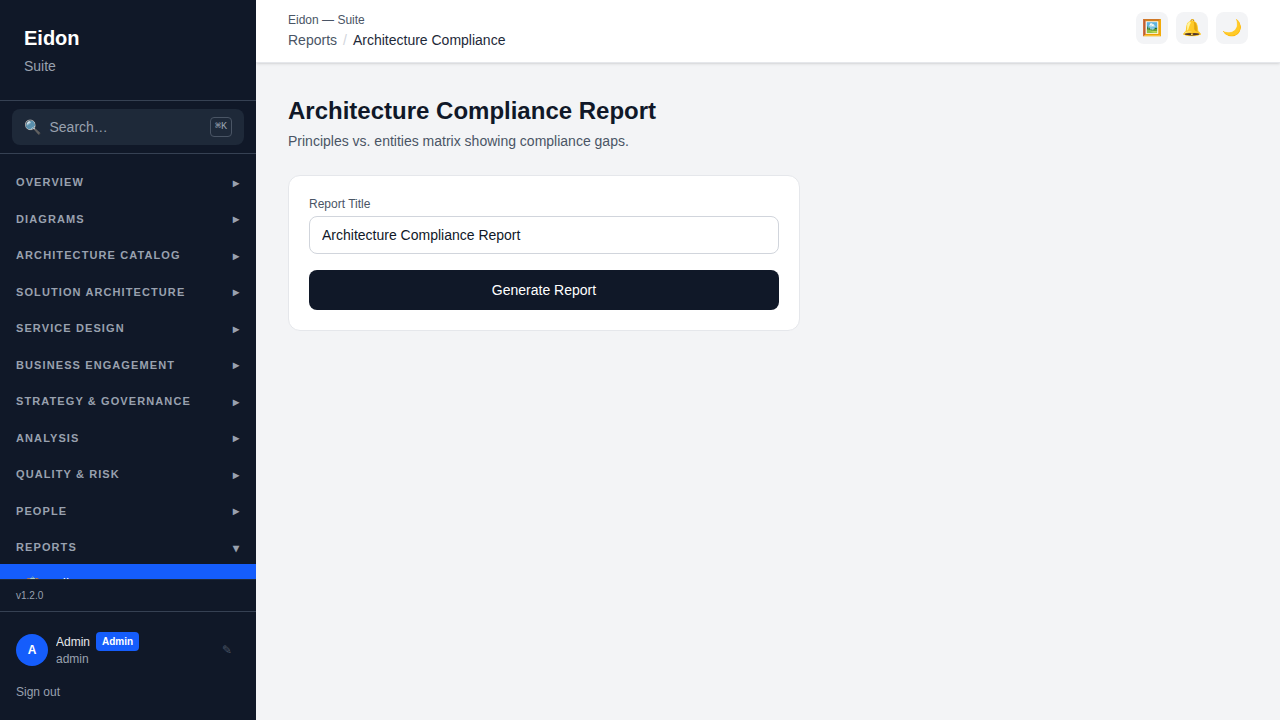
Compliance Report
A printable audit-readiness snapshot per compliance framework — control coverage percentages and any flagged gaps — suitable for handing to an external auditor without granting them access to the live tool.
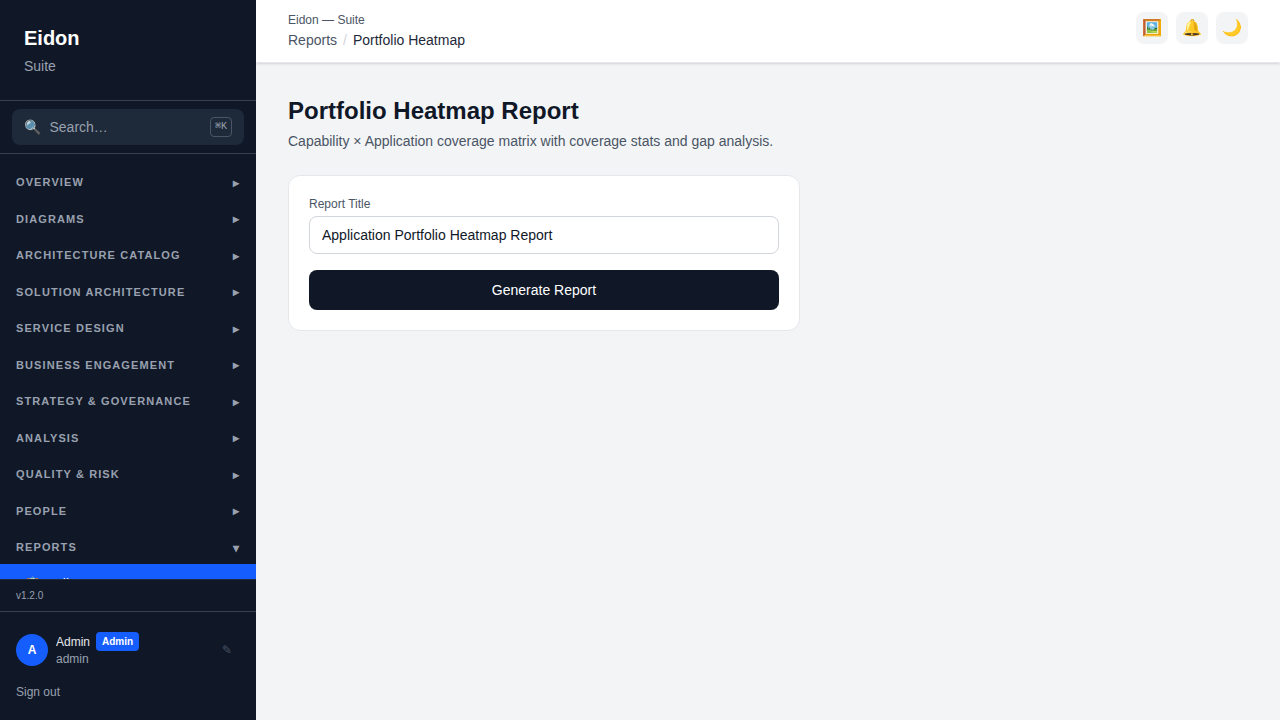
Heatmap Report
A printable version of the Portfolio Heatmap's Capability × Application coverage matrix, for including in a board pack alongside the other portfolio reports.
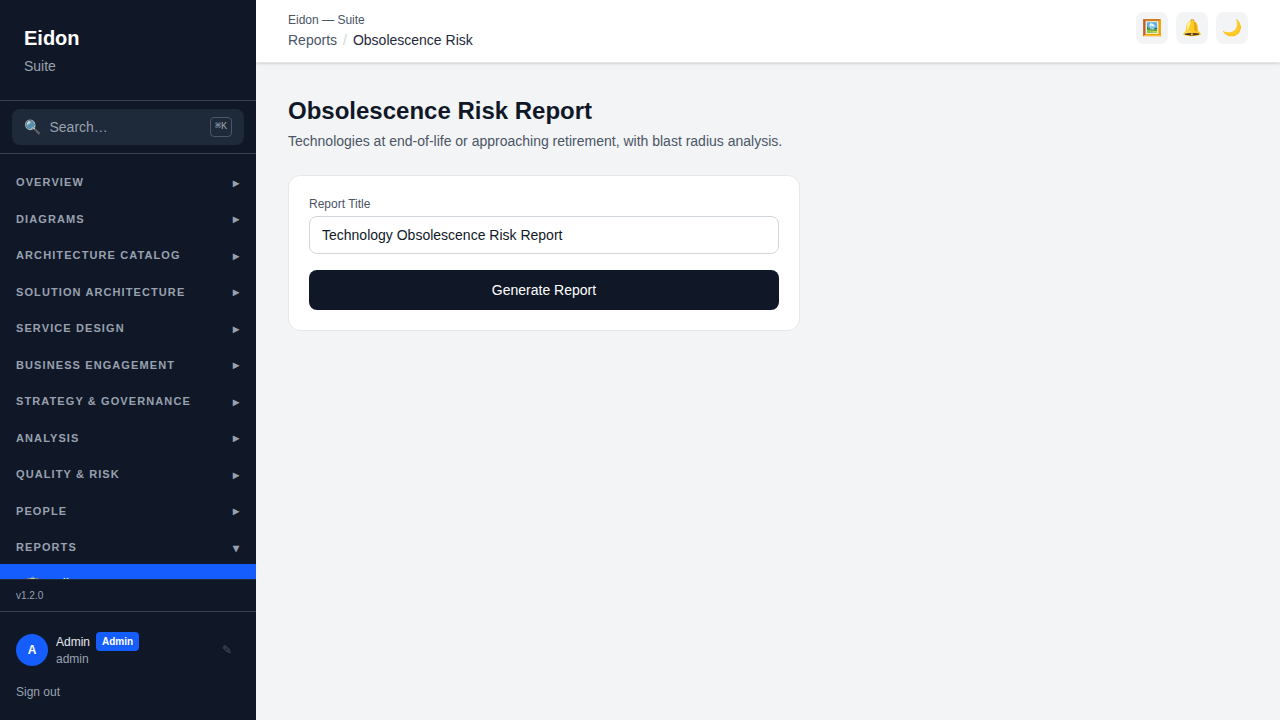
Obsolescence Risk Report
A printable summary of technologies flagged by the Obsolescence analysis, with risk level and dependent-application counts, for circulating to application owners ahead of a refresh cycle.
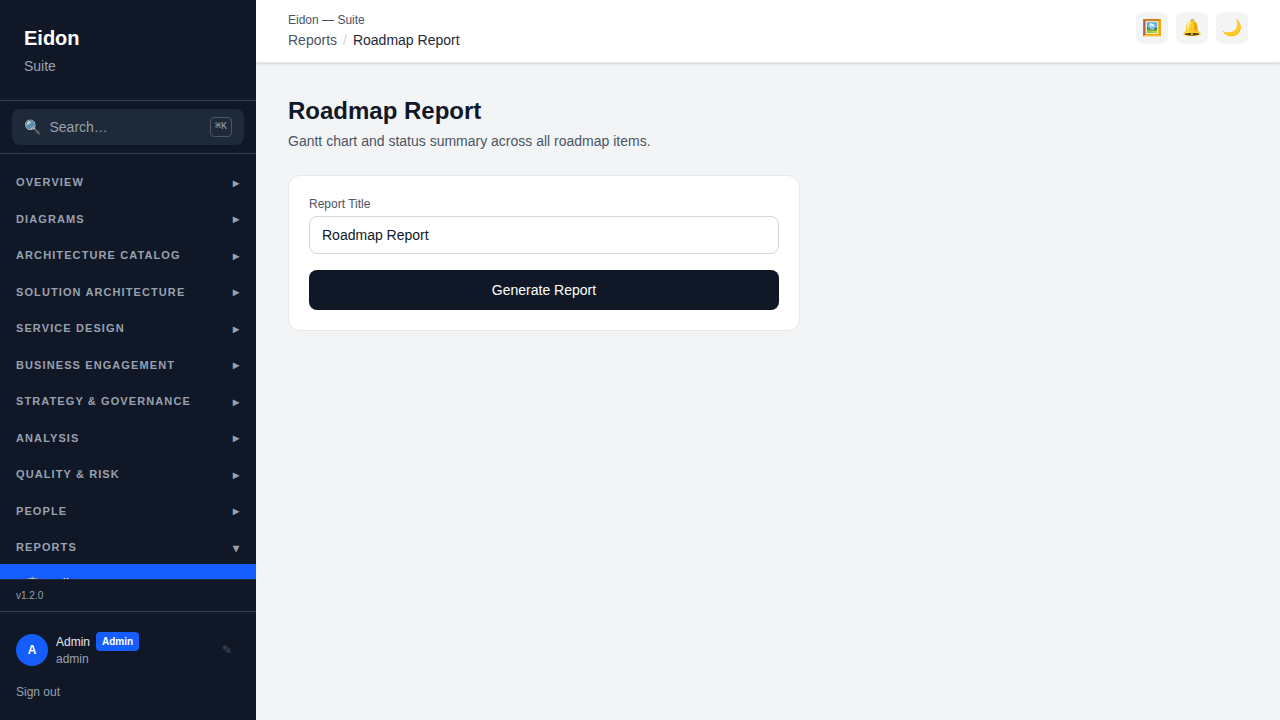
Roadmap Report
A printable version of the portfolio roadmap — items by swim-lane and quarter — for sharing outside the tool with stakeholders who don't need the interactive Gantt or Matrix views.
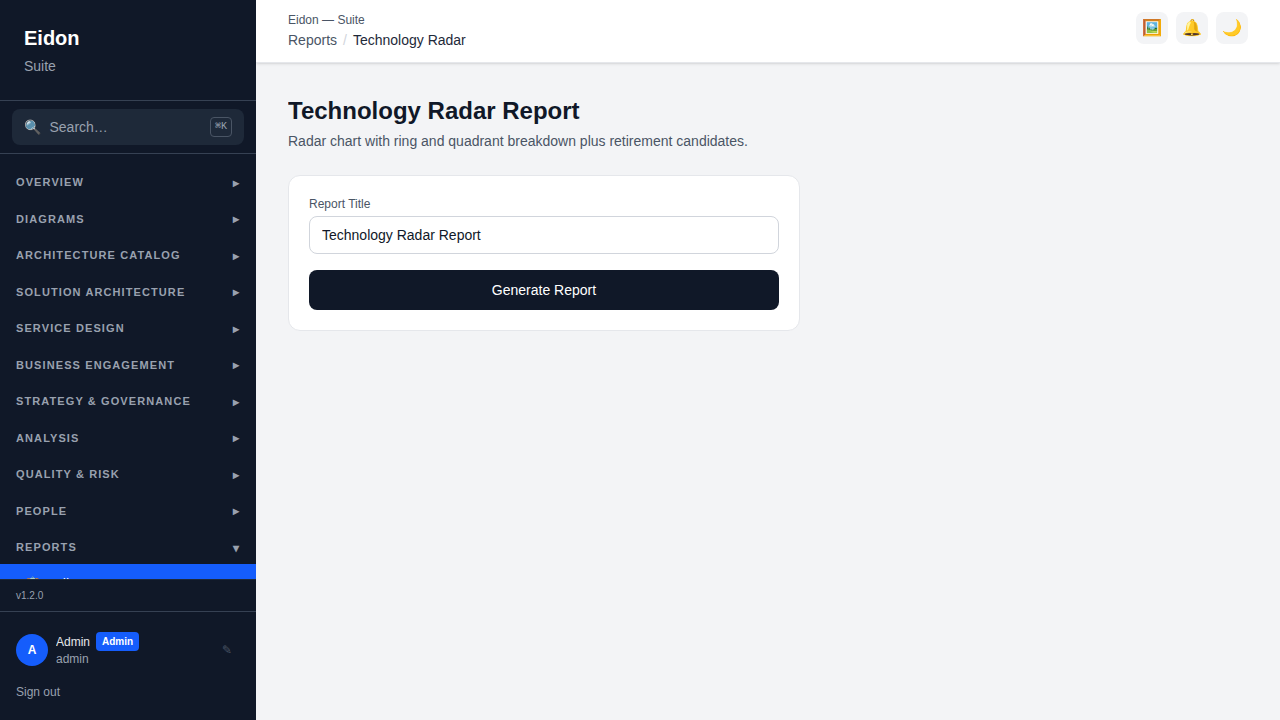
Tech Radar Report
A printable version of the Tech Radar's quadrant/ring plot, suitable for circulating to engineering teams as a point-in-time technology-standards snapshot.
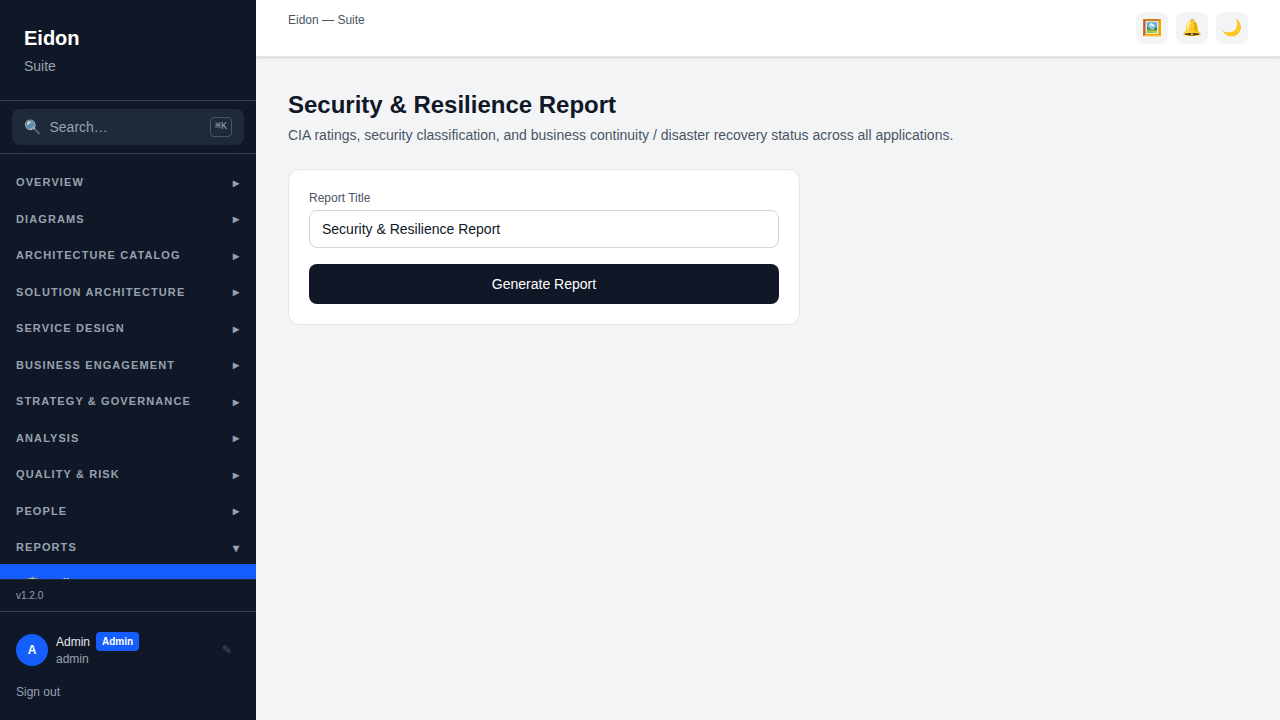
Security & Resilience Report
Aggregates every application's CIA ratings (confidentiality/integrity/availability), security classification, and business-continuity/disaster-recovery status, and flags governance gaps — critical applications with no DR or BC plan, and sensitive/protected data with weak confidentiality or integrity — as a dedicated security-posture report rather than something buried inside a general portfolio report.
Executive Summary & Entity Deep Dive
The Executive Summary is the single best one-page overview — portfolio, maturity, obsolescence, cost, risk, decisions, roadmap, data-quality coverage and security/resilience all in one printable page (see the Guided Walkthroughs chapter for a screenshot and the export steps). Entity Deep Dive is different in kind from the rest: instead of an aggregate view, it produces a full dossier for any single entity — its relationships, decisions, principles, comments and audit trail — the closest equivalent to opening one record's "fact sheet" and printing everything known about it.