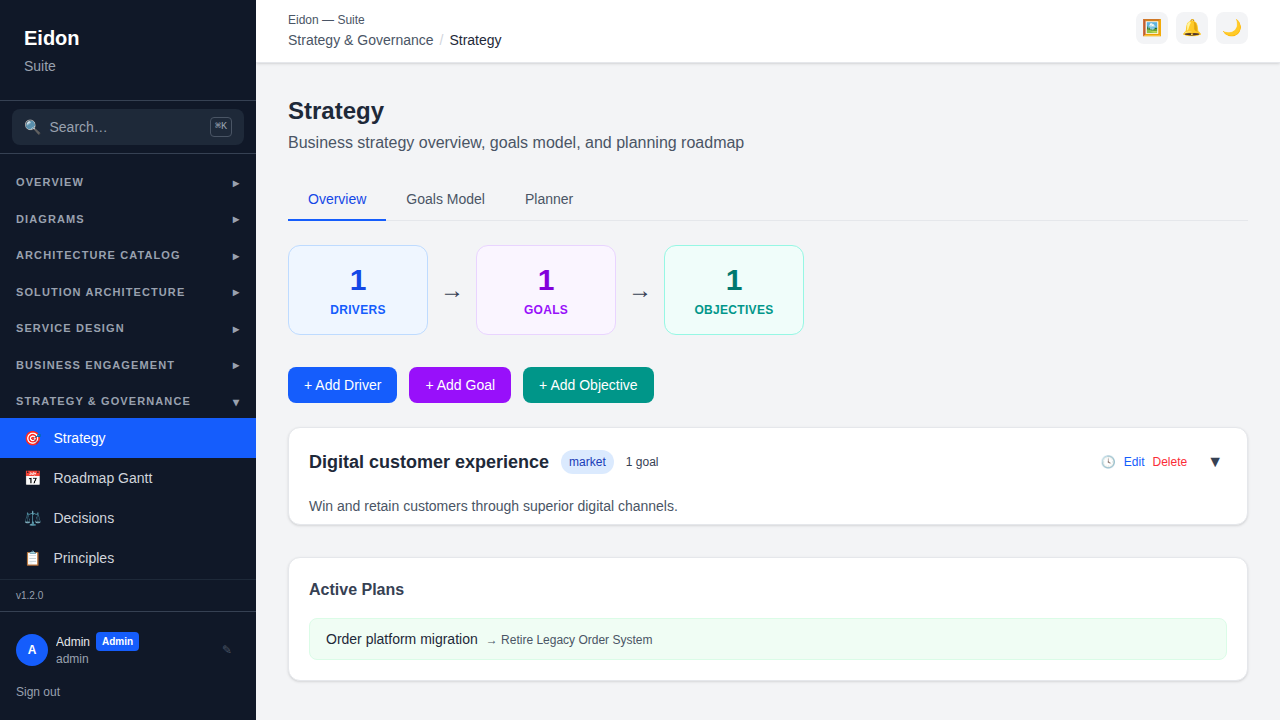
Strategy
Strategy hub (Drivers, Goals, Objectives, Measures, Roadmaps)
The Strategy page cascades Drivers (market/regulatory/technology/operational/financial forces) into Goals and then Objectives (each tagged with an org unit). Measures track KPIs, OKRs, Metrics or Targets against those objectives. Roadmaps hold quarterly (Q1–Q4) timelines made up of roadmap items, each with a swim-lane label, colour and date range.
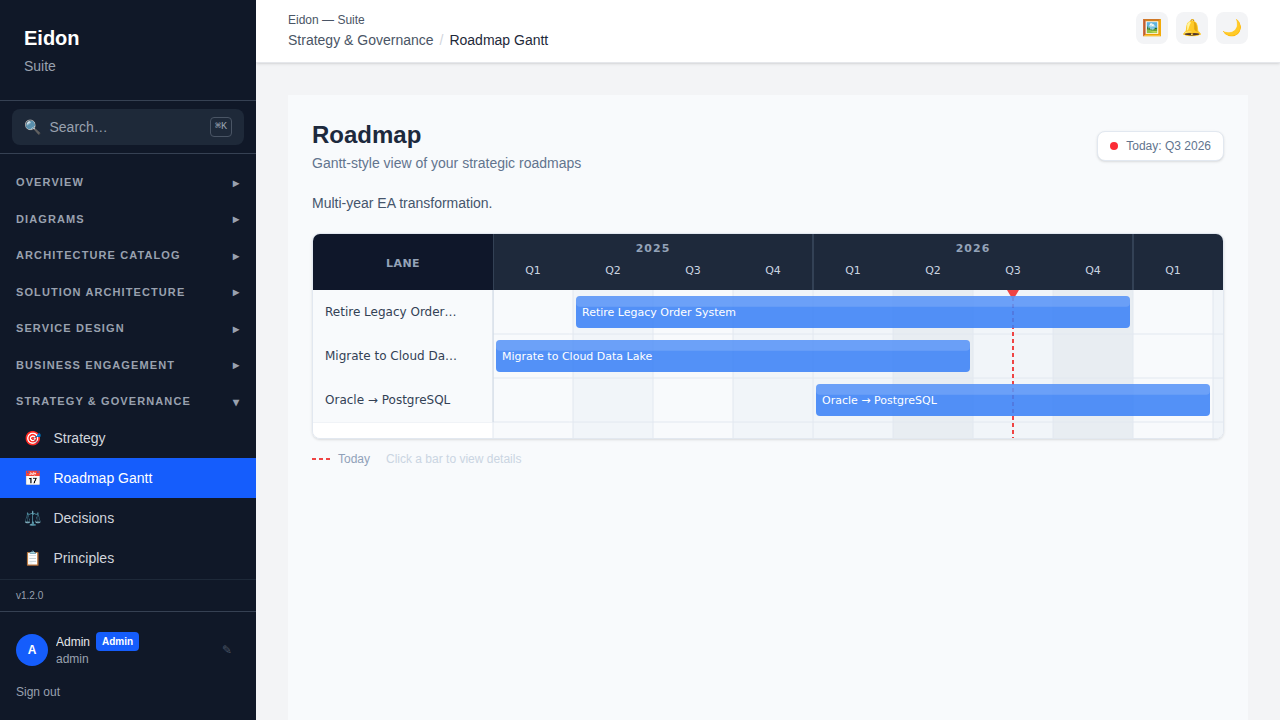
Roadmap Gantt
Renders roadmap items visually by swim-lane and quarter with a "today" marker, so a roadmap reads like a familiar Gantt chart rather than a raw table. Clicking an item lets you link it to the capabilities, applications or technologies it affects, with an optional note — this is also the same item type an accepted Business Engagement demand gets "promoted" into.
Delivery status: linking roadmap items to Jira/Azure DevOps
Each roadmap item can link to one or more Jira issues or Azure DevOps work items (configure the connection first under Settings → Connectors, gated behind the connectors plan feature) so its real delivery status shows up right on the Gantt — a coloured dot per link, refreshed automatically on a short interval or manually via the refresh icon.
Two write-back actions are available per linked item, both manual (nothing pushes automatically when a local status changes): the comment icon posts a note back to the Jira issue or ADO work item; the arrow icon moves it to a different status — for Jira this lists the workflow's actually-valid next statuses to choose from, since not every status is reachable from every other one; for Azure DevOps, which has no equivalent way to discover valid states generically, you type the target state name directly and ADO itself rejects it if that's not a valid state for that work item's type.
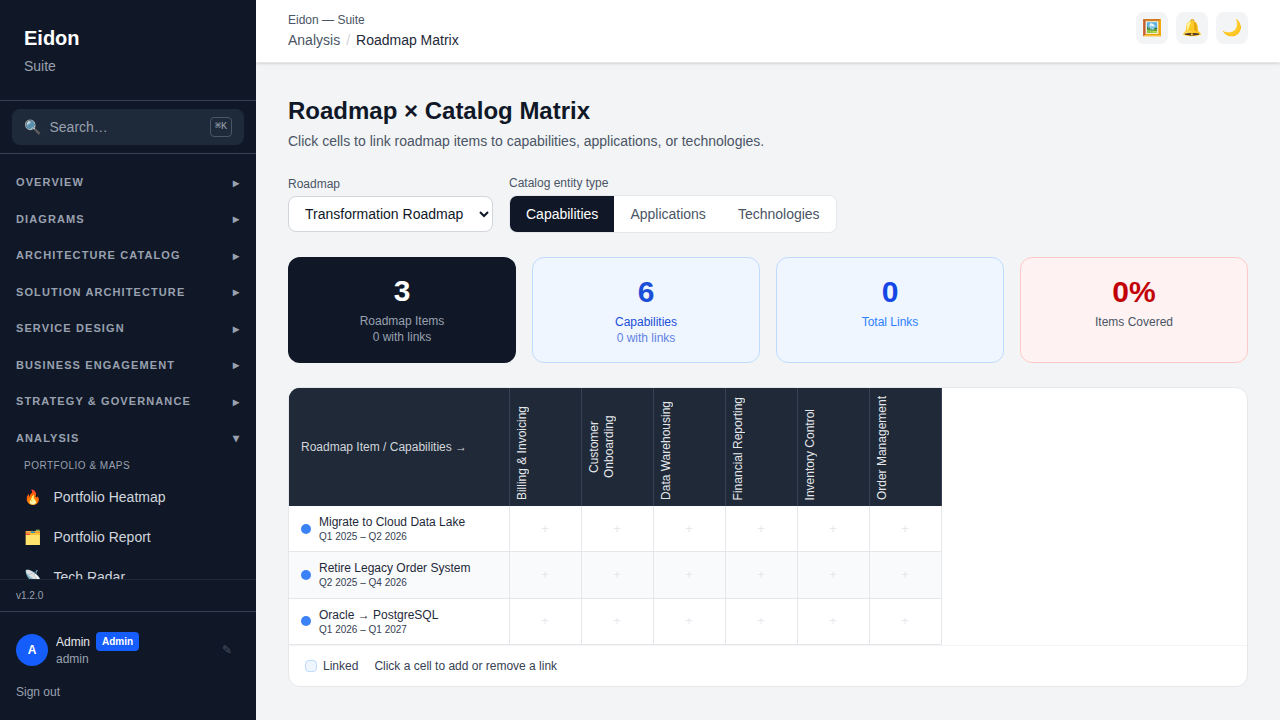
Roadmap Matrix
A click-to-toggle grid linking roadmap items (rows) to capabilities, applications or technologies (columns), showing a coverage percentage — a quick way to spot roadmap items with no catalog linkage yet, or catalog areas with no planned change at all.
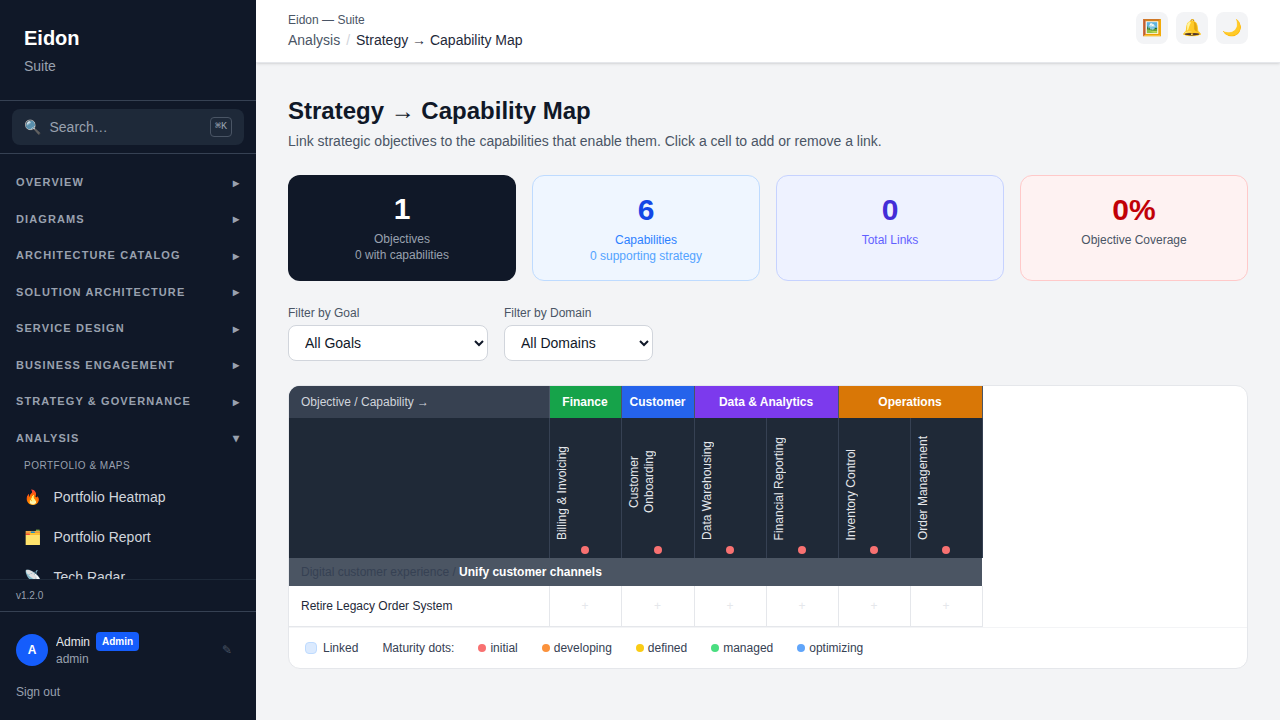
Strategy → Capability Map
A matrix linking strategic objectives (grouped by goal/driver) to capabilities (grouped by domain), showing how well strategy is enabled by the capability set — and, by omission, which objectives have no capability backing them yet.