Service Design
Loom (module "sd") documents services from the customer's point of view — personas, journeys and blueprints — and connects that experience layer back to the systems (applications, data assets) that actually deliver it. It also carries the operational side of running a service day to day: the Service Catalog's own agreements, support and operating structure, roles, and the Service Transition workflow for landing a specific change into live operation.
How it fits together
A Service is the anchor everything else attaches to, but it's the last thing you actually need — a Persona and a Journey Map can be built with nothing else in place. The natural flow: a Persona describes *who*; a Journey Map, optionally linked to that Persona, describes *what they experience* phase by phase; a Service Blueprint mirrors the same journey but shows *how the organisation produces it* internally, lane by lane, and is the piece that formally attaches to a Service. Touchpoints are a separate reusable catalog, referenced from both journey maps and blueprints rather than owned by either. Pain Points aren't created directly — they're cells inside a blueprint flagged ⚠, aggregated into their own register automatically.
Build order: Persona → Journey Map (link it to the Persona) → Service (if you don't have one yet for what you're documenting) → Service Blueprint (link it to the Service, and optionally generate its Target Architecture diagram once the lane grid is filled in) → flag pain points and moments of truth as you fill in blueprint cells, rather than as a separate pass afterward — they're properties of the entries you're already typing in.
Service Catalog
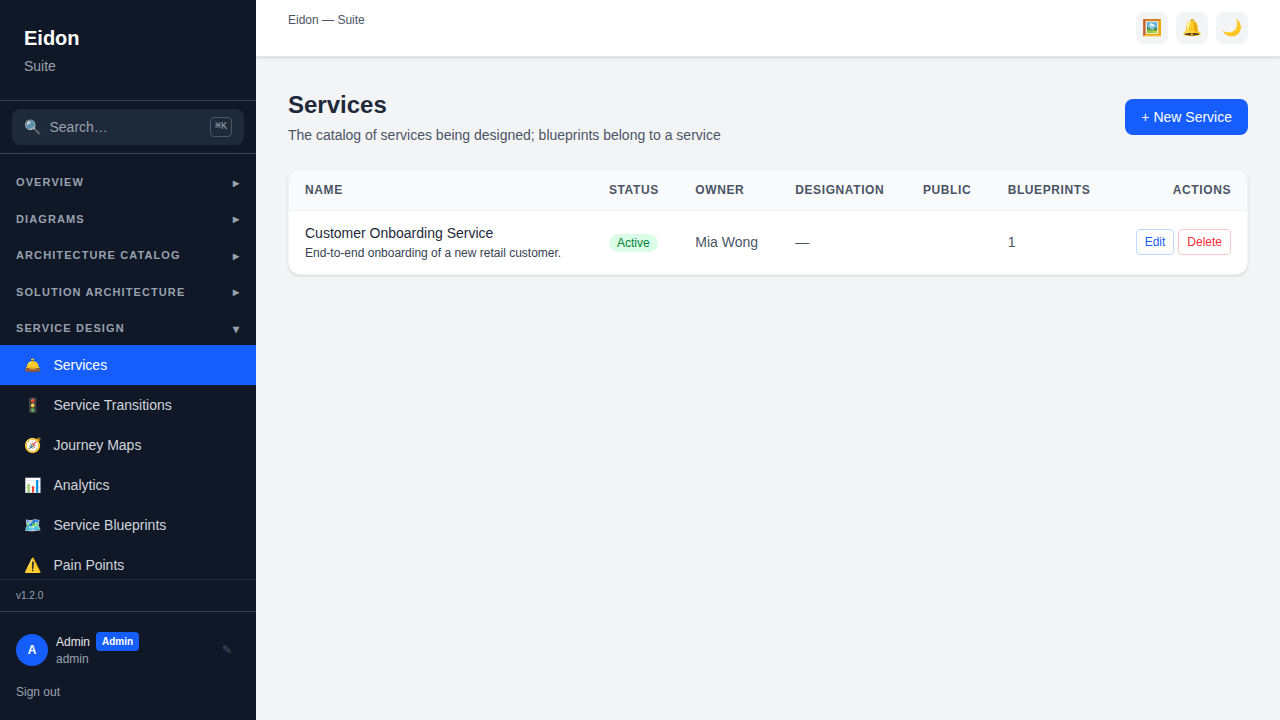
Services is the catalog of services being designed or run — each with a status (proposed/active/deprecated/retired), an owner and a description. A service is the anchor that Service Blueprints attach to; the list shows how many blueprints exist per service, and Service Design Analytics separately reports how many services have no blueprint yet at all, surfacing the coverage gap.
Service Management
Opening a service reveals its operational side, alongside the blueprints already linked to it: a tier/criticality and support hours; Service Agreements (SLAs/OLAs — a metric, a target, and an optional measurement window, e.g. "Availability: 99.9%, measured monthly"); Support Groups and Operating Functions; and Roles & Responsibilities.
A large support organisation rarely fits a fixed L1/L2/L3 scheme, so Support Groups are an open-ended list instead — each one optionally tagged with the layer of the stack it covers (infrastructure, database, application, ...), its coverage hours, and which of your Org Units owns it (left unset for an external group like a vendor, where the name alone carries the label). Each group can also point at another group it escalates to, so a chain like "App Support → DBA Team → Vendor Support" is explicit and walkable rather than assumed from a fixed tier number — and because it's a link rather than a strict sequence, more than one group can escalate to the same downstream vendor. Operating Functions (Monitoring, Change/Deployment, Capacity Planning, DR/BCP, ...) follow the same shape, each with its own owner and optional Org Unit link. Roles & Responsibilities stays a lighter list: a role, the person or team currently doing it, and what they're responsible for.
A service can be put through the same review-and-approval flow as a Solution Design or Service Blueprint (Review Requests or an Approval Chain), governing the whole record — including all of the Service Management data above — via its own Approval Status, kept separate from the service's day-to-day lifecycle status (proposed/active/deprecated/retired).
Service Transitions
Where Service Management is the static picture of a service, a Service Transition tracks one specific rollout of it into live operation — a v2 release, a migration, a major config change — through a fixed pipeline: Planning → Operational Readiness → Knowledge Transfer → Service Acceptance → Complete. A service can have several transitions over its lifetime, each tracked separately, and a transition can optionally be linked back to the Business Engagement demand that originally requested the change.
The Service Transitions board groups every transition by its current stage; opening one shows a Readiness Checklist — sign-off items tagged to Planning, Operational Readiness, Knowledge Transfer or Service Acceptance, each with an owner and a pending/done state — plus buttons to advance (or step back) through the pipeline one stage at a time. The last step, Service Acceptance → Complete, can also be routed through a Review Request or Approval Chain instead of advanced directly, the same governance pattern used elsewhere in the suite — the transition simply sits at Service Acceptance, already at its natural awaiting-sign-off point, until that review resolves.
A transition shows up as a "Referenced By" entry on both its Service's and its linked Engagement's detail pages, so either one always shows what's currently in flight against it.
Personas
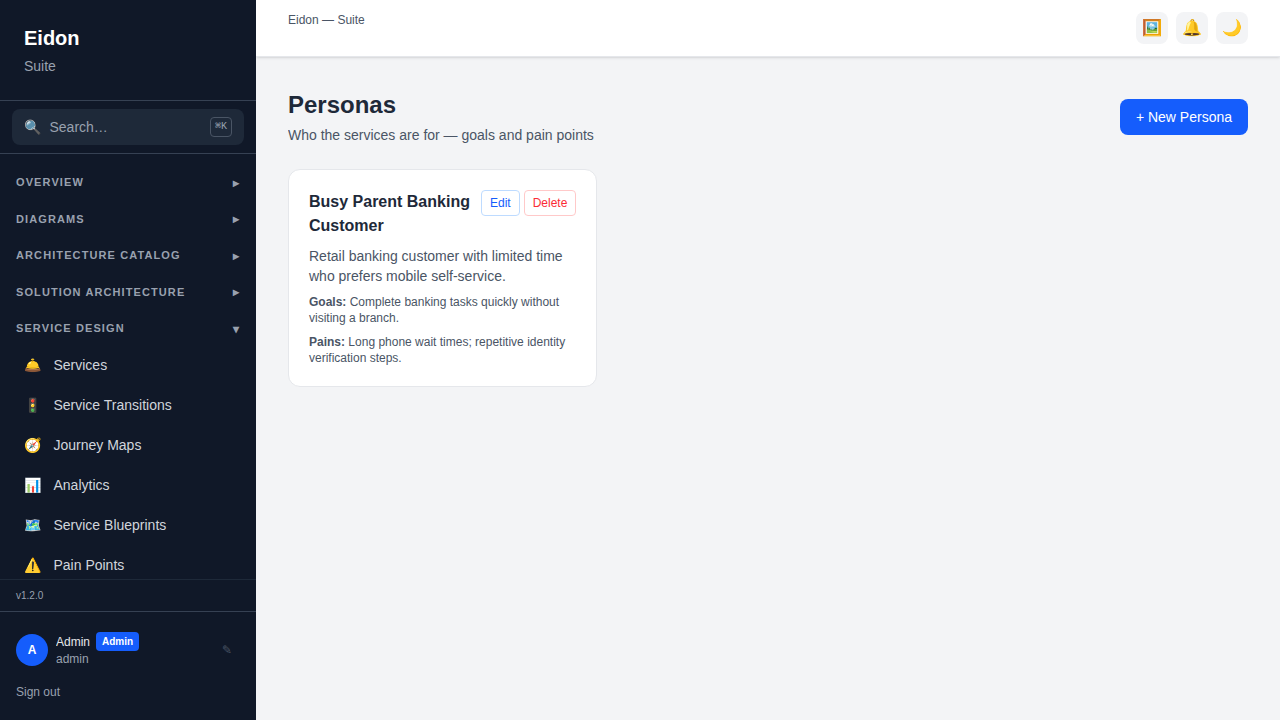
Personas describe who a service or journey is designed for: a name, a description, their goals, and their pain points. A Journey Map can be linked to a specific persona so a journey is understood as "this customer's" experience rather than a generic one, and personas are reused across multiple journeys and blueprints rather than redefined each time.
Customer Journey Maps
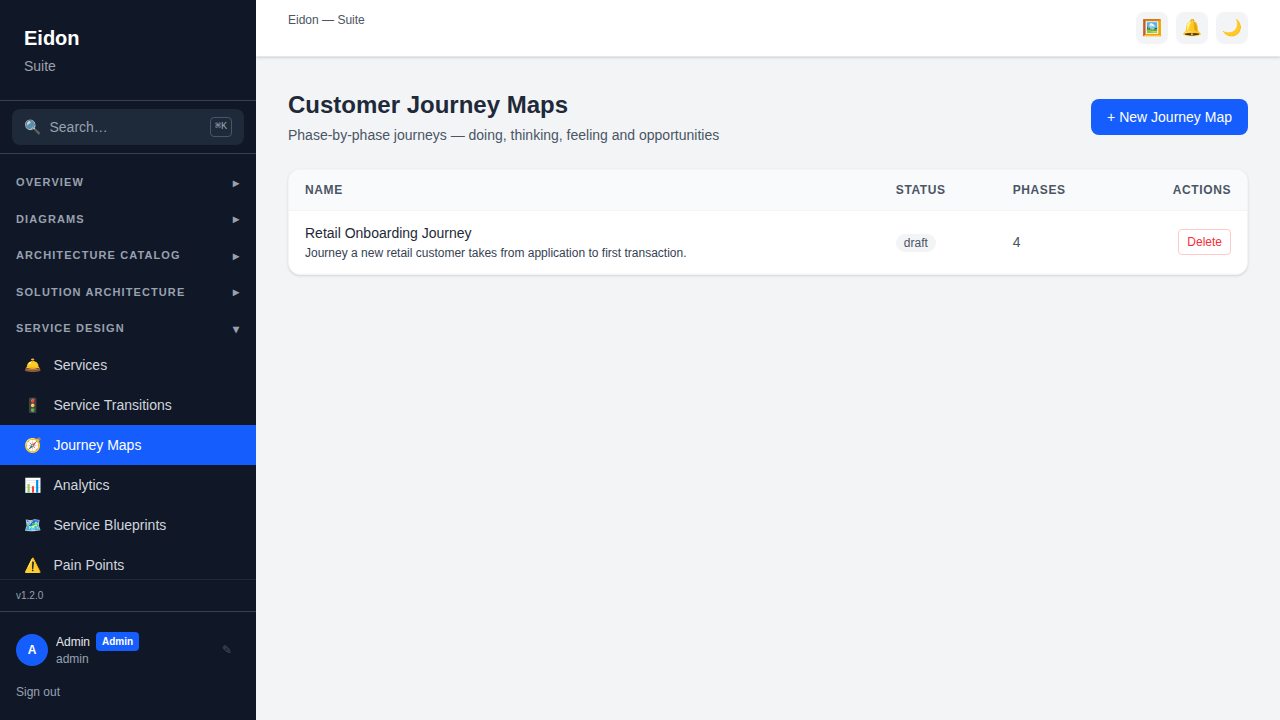
A journey map lays out phases across the top (e.g. Awareness, Application, Verification, First Use) and customisable rows down the side (typically Doing, Thinking, Feeling, and an Opportunities row for improvement ideas), with free-text entries in each cell. Each phase also carries an emotion score from 😞 to 😀, and Service Design Analytics automatically surfaces the lowest-mood phases across every journey map — the moments most worth fixing first — plus an aggregate average mood and running counts of phases and logged opportunities.
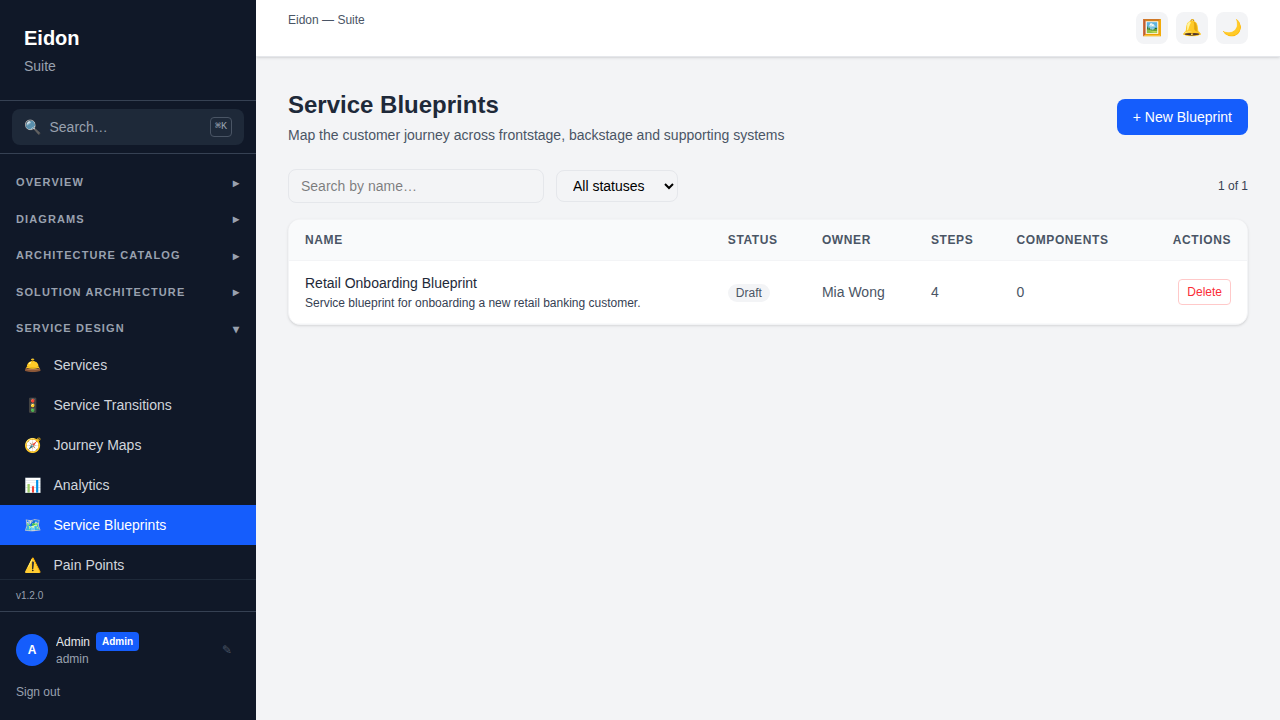
Service Blueprints
Where a journey map shows the customer's experience, a Service Blueprint shows how the organisation actually produces it: lanes (customisable, typically Frontstage, Backstage, Supporting Systems, and a Metrics lane) across steps of the same journey. Each cell holds one or more typed entries — Note, Action, Touchpoint, System, or Evidence — and any entry can be flagged ⚠ as a pain point or ★ as a moment of truth, which is what feeds the Pain Points register and the pain-point heatmap in Analytics. A blueprint links to Components (the applications and data assets that underpin each step) and can generate a Target Architecture diagram directly from its lanes and links. Like Solution Designs, blueprints support Review Requests, an Approval Chain, Recertification, and Markdown/PDF export — the PDF is a formatted landscape report with a branded cover, headline counts (steps, lanes, pain points, moments of truth) and the full lane grid rendered in the editor's own colour language, and a Journey Map's PDF likewise opens with an emotion-curve chart across the phases.
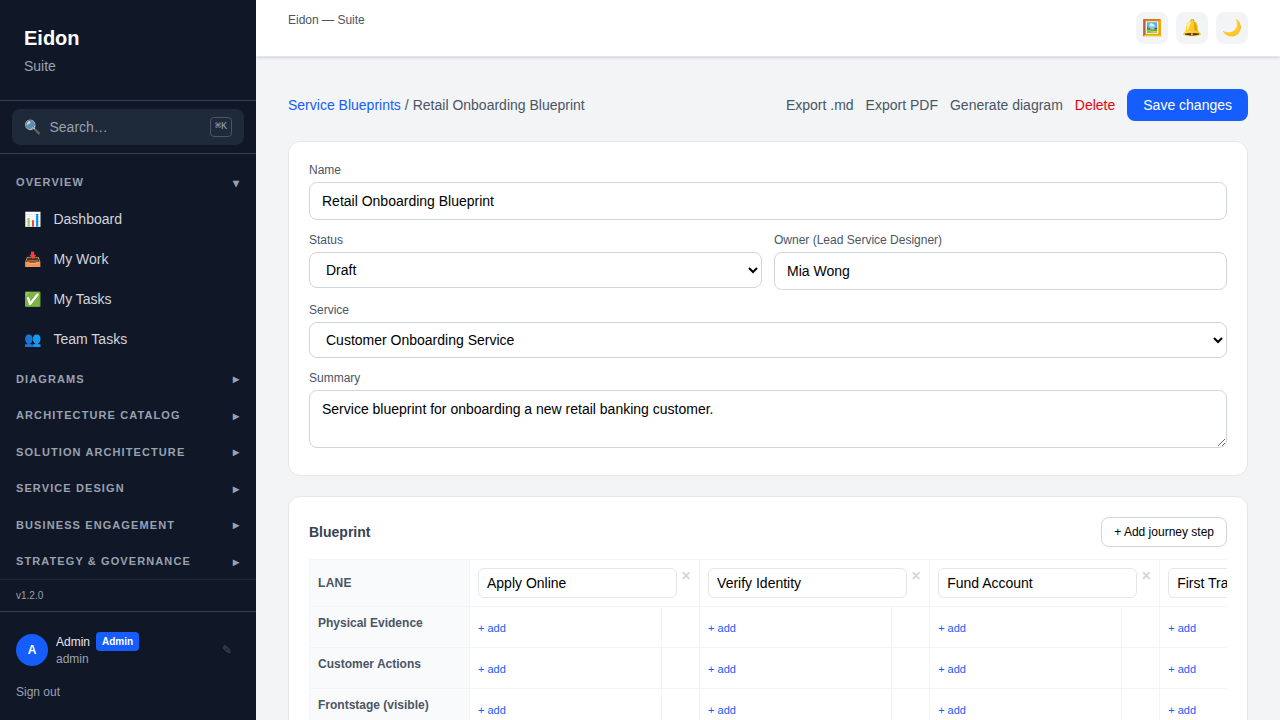
Service Blueprint detail
Opening a blueprint shows the full lane grid — lanes as rows, journey steps as columns — with each cell editable inline: add an entry, set its type, and toggle its pain/moment-of-truth flags directly. Below the grid, the same Components, Diagrams, Governance (review/approval), Recertification and Related Artifacts panels used on Solution Designs keep a blueprint's provenance and downstream links visible from the one page.
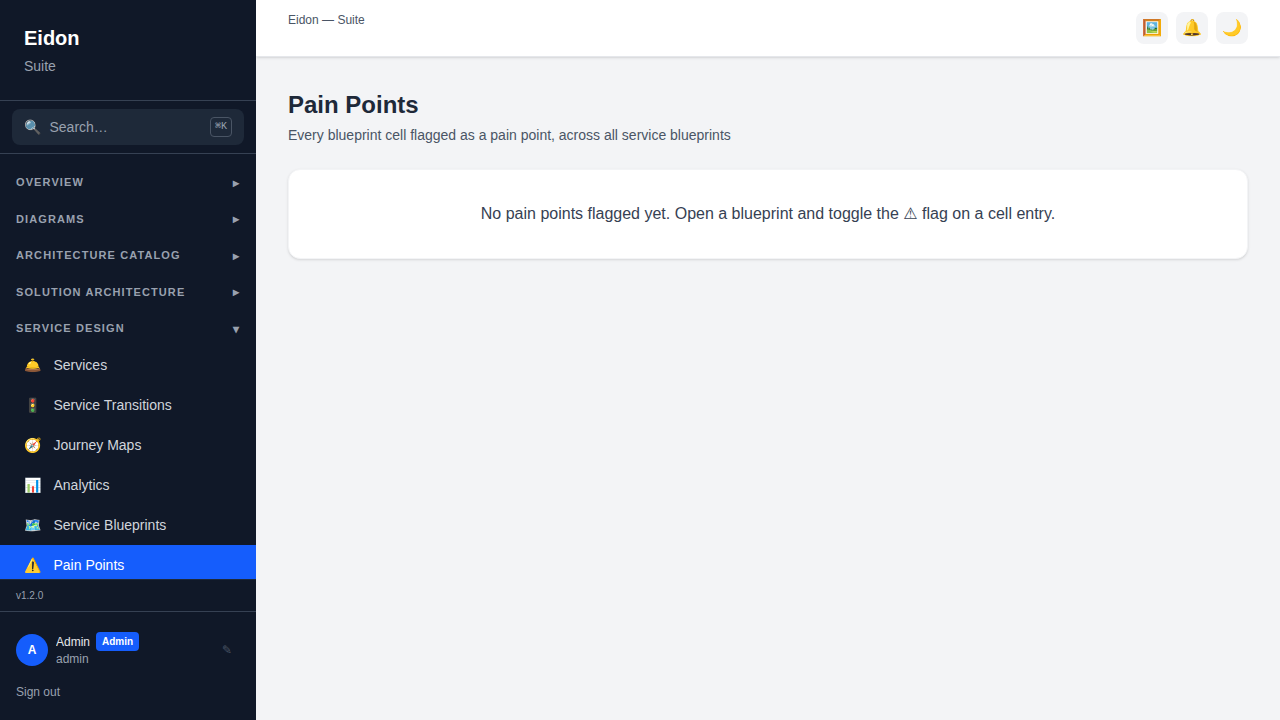
Pain Points
A single register aggregating every cell across every service blueprint that has been flagged ⚠ as a pain point, regardless of which blueprint or lane it came from — with a link straight back to the originating blueprint and its lane/step context. This turns a flag buried in one blueprint's grid into a workspace-wide, sortable list that a service owner can triage without opening every blueprint individually.
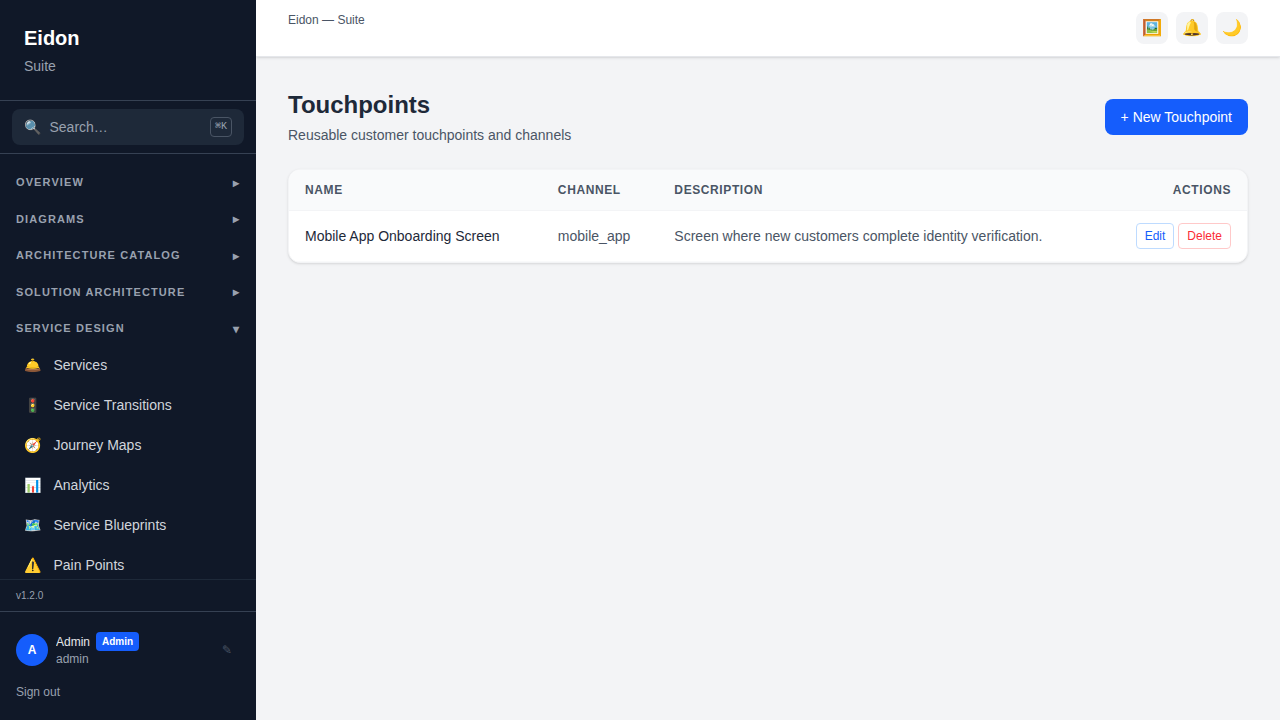
Touchpoints
A reusable catalog of the channels and touchpoints customers interact through (e.g. "Mobile App Onboarding Screen", channel: mobile_app), each with a description. Touchpoints are referenced from journey maps and blueprints and rolled up by channel in Service Design Analytics, so you can see at a glance whether the touchpoint catalog is dominated by, say, phone and branch versus digital-self-service channels.
Service Design Analytics
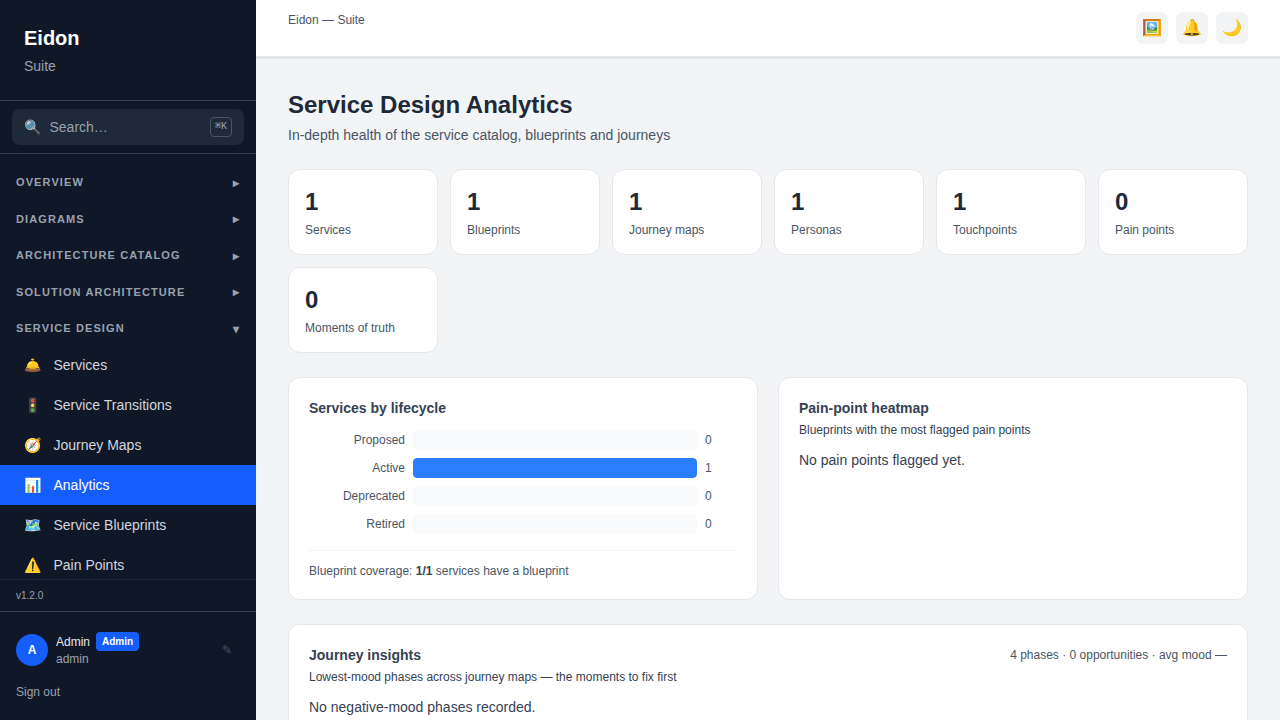
A rollup across the whole module: services by lifecycle status and blueprint coverage; a pain-point heatmap ranking blueprints by flagged-pain count; journey insights (total phases, opportunities logged, average mood, and the lowest-mood phases specifically); a "systems underpinning services" view showing which applications and data assets are referenced by blueprints (and therefore what the blast radius would be if one were retired); services by owner; blueprint coverage gaps (services with none yet); and touchpoint-channel distribution.